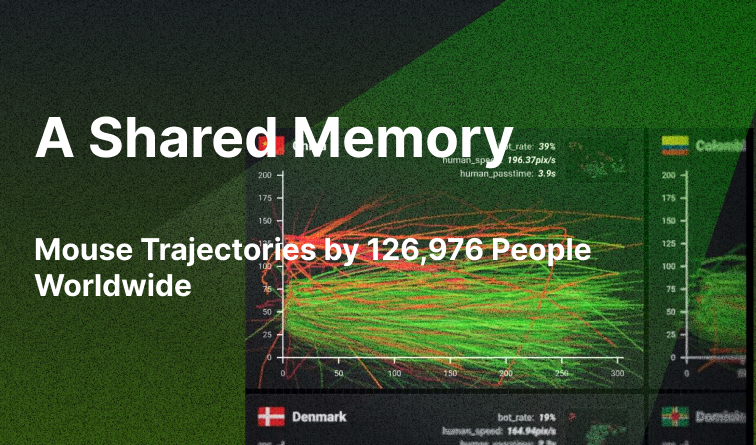
Imagine, for a moment, a group of people who have never met have converged to shape this image created by 126,976 individuals coming from 124 countries and regions worldwide. If you happen to be a player of Axie Infinity or Genshin Impact or a user of Binance, the world’s largest crypto exchange, or you’ve ever purchased anything from Nike online, you may discover that you are one of the creators who contributed to this captivating image.
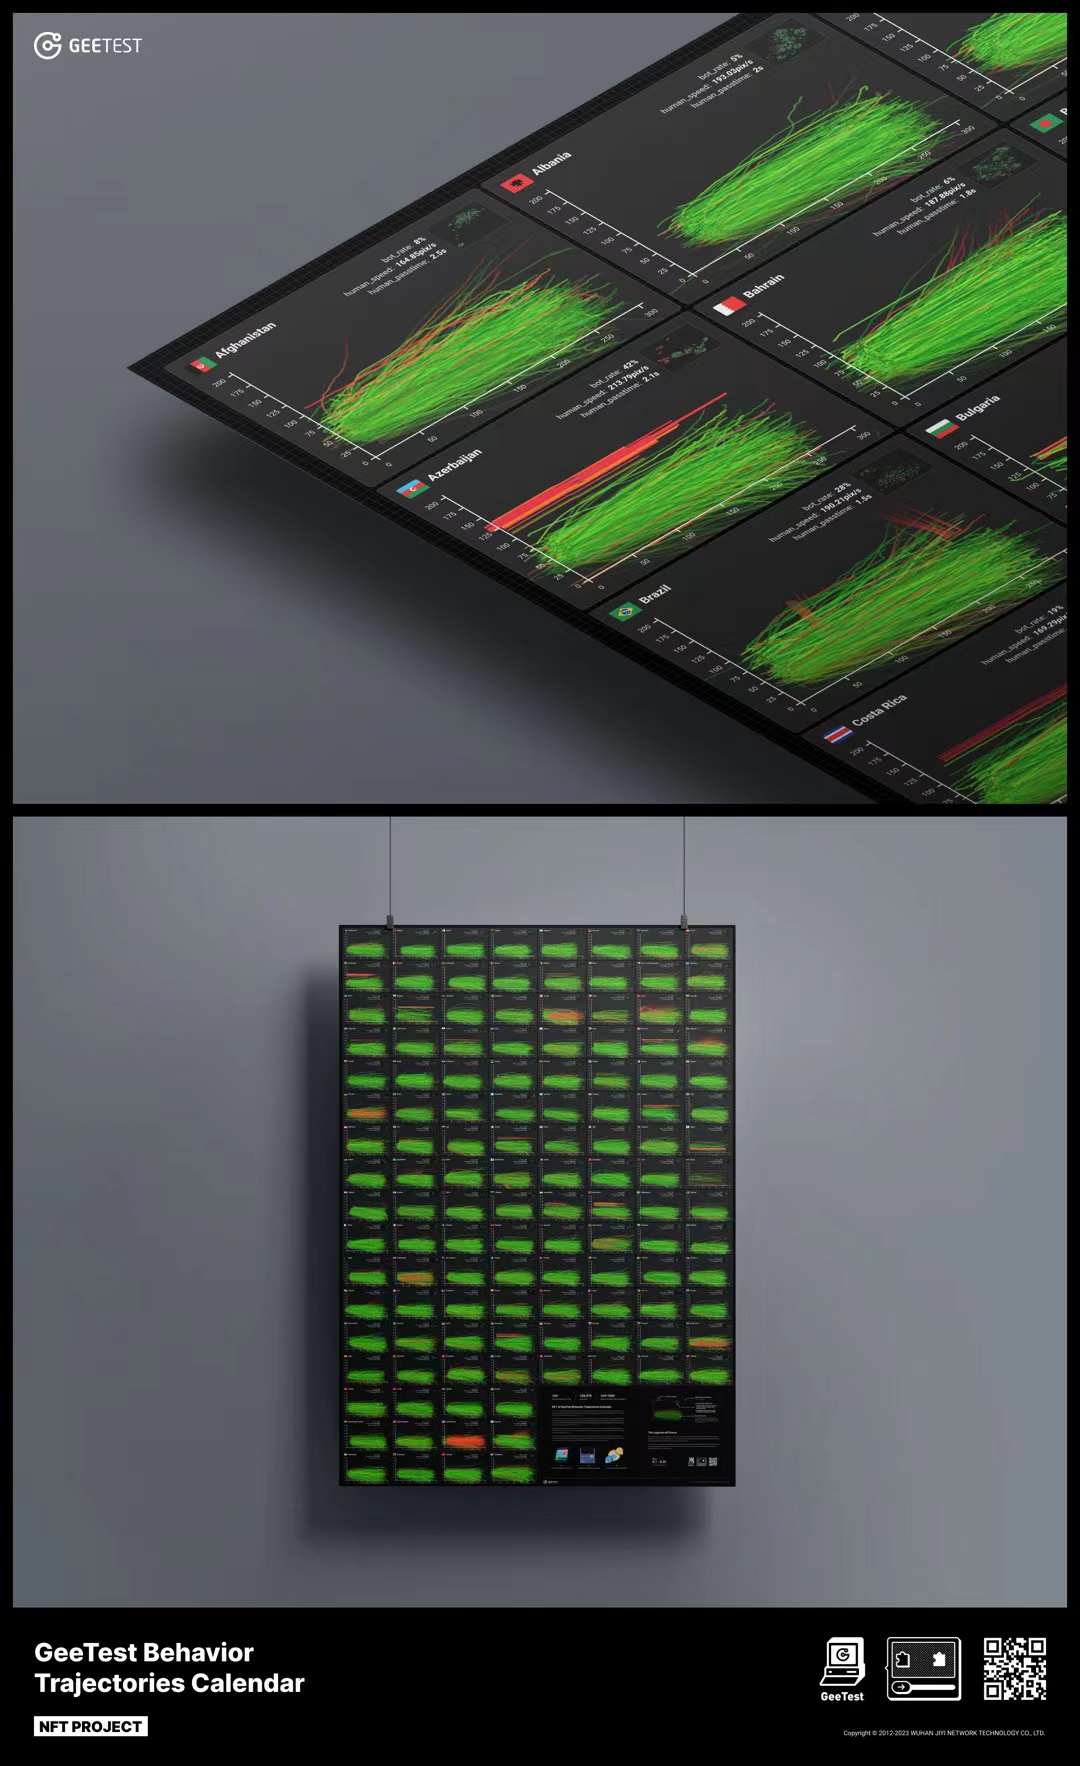
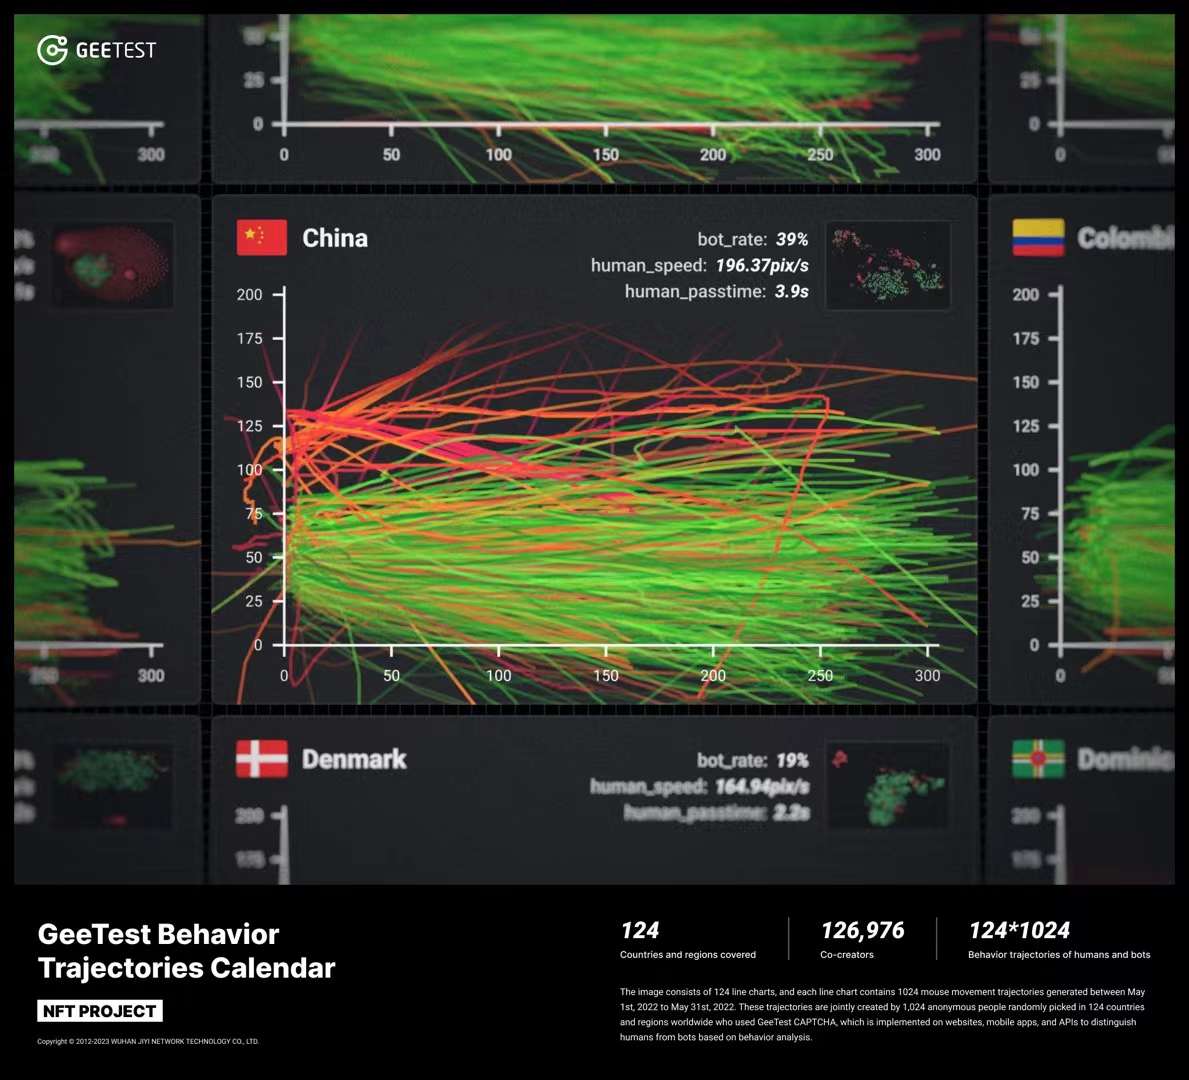
The image comprises 124 line charts, each containing 1,024 mouse movement trajectories captured between May 1st, 2022, and May 31st, 2022. These trajectories were collaboratively created by 1,024 anonymous individuals randomly selected from around the world who used GeeTest CAPTCHA, which is implemented on websites, mobile apps, and APIs to distinguish humans from bots based on behaviour analysis.
Now, let’s take a closer look at the details.
The scatter charts
In the upper right corner of each line chart, a scatter chart displays the distribution of human and bot trajectories. Each dot on the chart represents a trajectory, capturing essential behaviour features extracted from around 200 high-dimensional behaviour features identified by Convolutional Neural Networks (CNN), cleverly reduced to two dimensions using UMAP.
Green lines and red lines
The line charts themselves depict human and bot behaviour through coloured lines.
The green lines in the line charts represent the human trajectories generated from PC and mobile devices, which are formed into two clusters. The red lines represent bot trajectories. It is very clear that the distribution of human behaviour trajectories and bots is quite different.
You probably haven’t heard of GeeTest, but if you’ve ever used the Internet for activities like live-streaming of online games, booking a flight or a hotel, chatting with friends, or making online payments, etc, you must have met CAPTCHAs before, then you’ve very likely met GeeTest too.
As a testament to its significance, this image has been transformed into an NFT and is now listed on OpenSea. If you’re intrigued and want to explore this shared memory of netizens, feel free to check it out.